Patient-centricity is transforming the pharma industry
“There is a wind blowing through the pharmaceutical industry, a force with the power to fundamentally transform every function, every stage of the pipeline and every marketed product. This force is driven neither by cost-containment nor regulatory pressure, it is neither a clever gimmick dreamt up by a management consultant nor a knee-jerk reaction to a market dynamic. What’s more, to an outsider, it looks like the industry has taken a long time to wake up to its potential. This force is the patient, of course, the end-user of our medicines, the person who has, in Europe at least, been far from the forefront of pharma thinking.”
Hugh Gosling, Editor, Pharmatimes.com May 2016

According to a 2014 Eyeforpharma survey 86% of pharma executives feel that patient-centricity is the key to their profitability. Eyeforpharma again in a 2016 webinar stated that:
“HCP engagement is key to any pharma commercial model. Patient-focused engagement is the key to improving overall performance in face to face visits.”
One of the ways pharma puts patients in the centre now is through market research. Patient journey research offers a broad understanding based on qualitative and quantitative data, but focused around the disease a product treats. There’s also the more broadly based “day in the life of” research which tells us more about the patient beyond their disease. These approaches are very useful and can be complemented by a tool that can both help focus your market research so that you talk to the right people, and broaden your patient understanding.
A different angle on implementing patient-centricity
Before you begin your own primary market research with patients, take the time to understand potential patients through the public information that already exists. There’s a lot of information available about
- People with specific diseases
- About general health and lifestyle
- Which can be combined and modelled by geography
- Using data sources such as:
- Census information
- Government microdata
- Personal values surveys
- Quantitative market research
- Behavioural data
- Web traffic
For example, ABS National Health Survey microdata can be data mined to reveal a range of insights into people with say diabetes, their health and lifestyle habits such as:
- People with diabetes are:
- 6 times more likely to have hypertension than other people
- 6 x more likely to have private health insurance for 5+ years
- Over 4 times more likely to have cataracts, macular degeneration and glaucoma
- 9 times more likely to have visited a chiropodist/podiatrist
- 5 times more likely to use medication for mental wellbeing
- 4 times more likely to spend 10+ hours/day sitting at leisure
These are just some numbers I’ve pulled out from this analysis, from hundreds of variables. Obviously when you are working to a strategy, you look at the variables relevant to your strategy
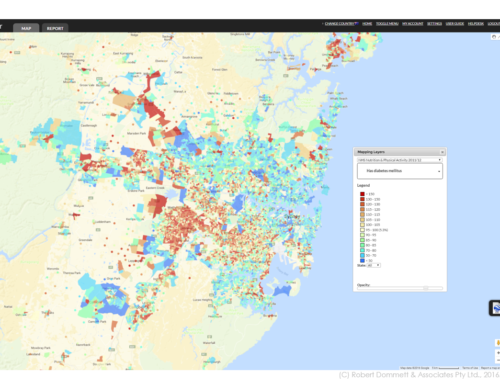
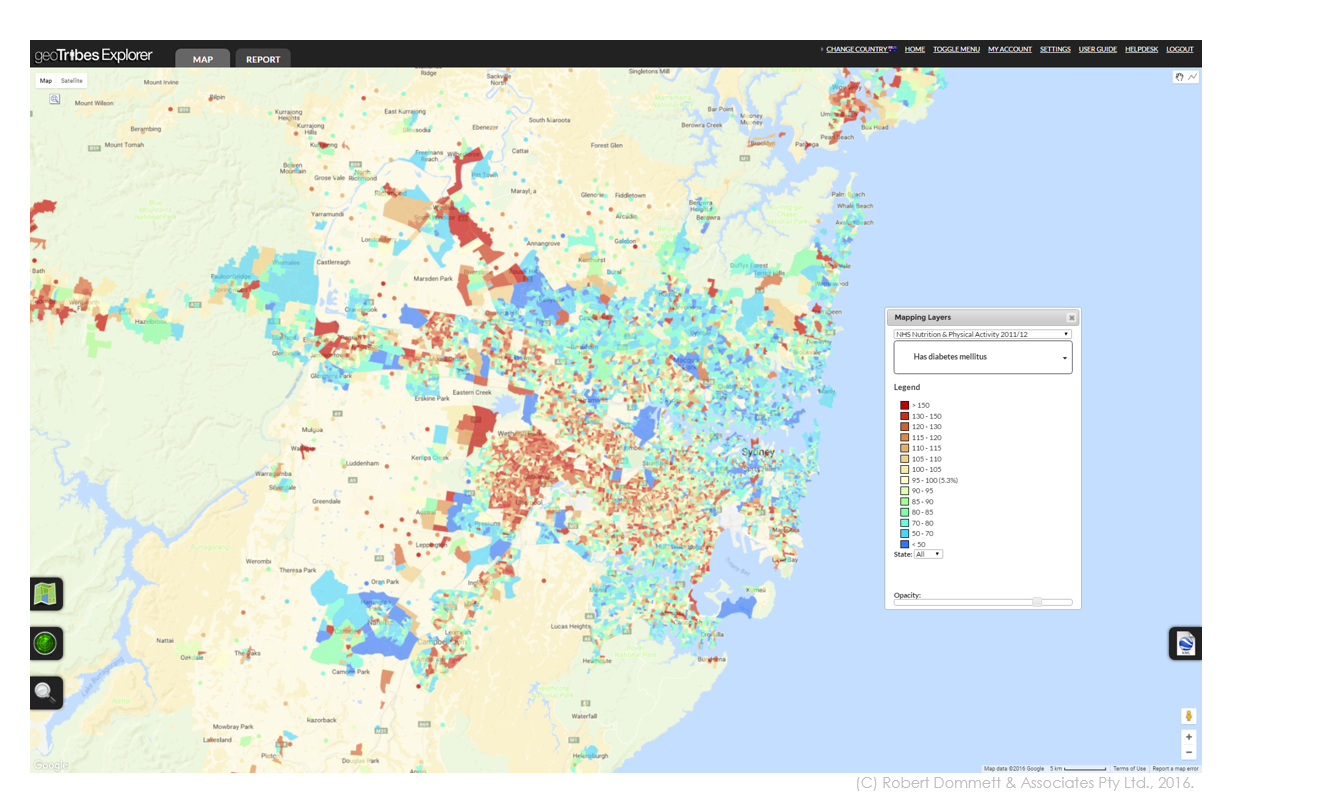
Mapping patient locations
It is possible to model areas where people with certain diseases live and add this information to your targeting efforts. An example of how the National Health Survey can be used to model disease prevalence is the Social Health Atlas provided by Torrens University. Whilst interesting, this tool only maps the data at a fairly high level of aggregation.
 At Pivotal, we are able to go further and model data for very small geographic areas. This gives us flexibility in re-aggregating the data to areas of use to our clients, eg sales territories. We can also model patients into GP practice catchment areas.
Uses for this type of information include the obvious of better targeting through identifying areas of higher and lower patient potential. It becomes possible to have better HCP conversations through better patient knowledge. Locally relevant information can be used to help reps have a patient focused engagement with their HCPs.
It’s also possible to go well beyond just age and sex descriptors to profile patients. Having done this, the best media sources can be identified tor specific groups of patients, whilst patient compliance programs can be improved through customising the resources provided to patient subgroups.
Using National Health Survey data allows you to paint a more complete a picture of your patients, including an understanding of how they differ from territory to territory. Put the patient, not just your product, at the centre of your story.


